


The Chicago Maroon has asked incoming first-years to participate in a survey on topics ranging from family background to political identity to expectations for the future. This year, 544 out of the 1,740 first-year students, or just under a third of the class, provided responses. Over the past two years, the University has altered its admissions policies by accepting a larger class size and introducing two Early Decision rounds on top of the existing Early Action round. But how, if at all, have these changes altered the composition of the class?
Due to sampling biases from the voluntary nature of the survey, the results may not be perfectly representative. However, the results from the survey offer a detailed snapshot of the Class of 2021 and show some relationships between different aspects of a UChicago student’s background and opinions. In particular, income level, religion, and political identification seem to be related to the majority of student opinions and backgrounds. Despite the multiple changes in admissions in the past year, the makeup of the Class of 2021 follows many trends of previous years.
Demographics
As in previous years, more female-identified than male-identified students responded to this year’s Maroon survey. There were three non-binary responses, including genderqueer and genderfluid. Specifically, almost 7 percent more respondents identified as female, even though the official University profile of the Class of 2021 reveals a slight majority of incoming students are male—52 to 48 percent.
There is a relationship between type of high school and gender identification, as was the case in last year’s survey. From students coming from private schools, the gender ratio of response rate was 51 to 49 percent. In public schools, however, the scale tips, with the respondents being 44 percent male and 56 percent female. The representation of different sexual orientation of the class is also similar to last year’s, with just over 75 percent of students identifying as straight, just under 10 percent as bisexual, and almost 6 percent gay or lesbian.
However, the ethnic composition of the Class of 2021 demonstrates a slight change from that of last year. The percentage of white students rose by almost 10 percent, from 49 percent to over 57 percent, with the percentage of Asian students following the same pattern, rising from 21 to 25 percent of the class. At the same time, the proportions of Black, Indian, Middle Eastern, and Hispanic/Latino incoming students fell compared to the previous year. Though the sharp increases in White and Asian proportions of the class are notable, changes in the racial and ethnic compositions of classes from year to year are common.
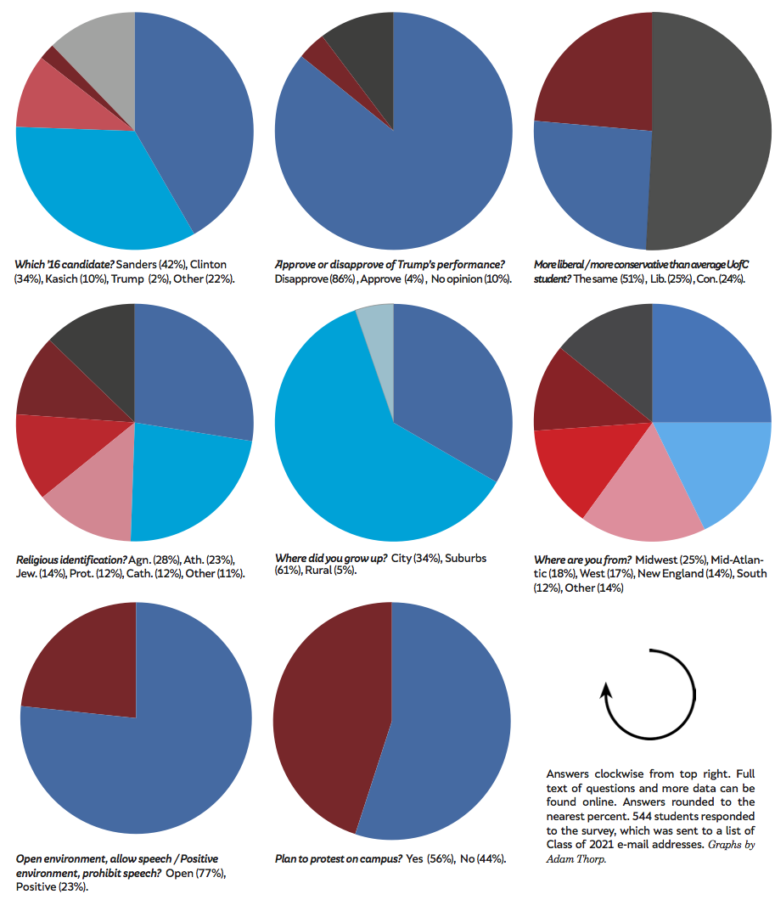
Student responses reflect the geographic distribution shown by the official University profile. The largest pools of students came from the Midwest and Mid-Atlantic regions, which each made up almost a fourth of incoming students. As usual, the plurality of students at UChicago came from the Midwest. 61.3 percent of first-years report coming from the suburbs, 33.6 percent from a city, and 5.2 percent from a rural area.
This statistic remains relatively unchanged from the previous year.

Religious Identity and Politics
Despite the numerous changes to admissions instituted in the past year, many aspects of students’ religious and political identities remain relatively unchanged. Among the incoming class, 26.9 percent identified as atheist and 22.2 percent as agnostic. The next three largest religious groups—Jewish, Protestant, and Catholic students—each represent over 1/10 of the class; the remaining 10 percent of the class identified as Hindu, Muslim, Buddhist, or Other. Christianity as a whole, however, was the second largest religious group, with 25 percent of students. When asked how religious they were on a scale of 1 (least religious) to 5 (most religious), 46.3 percent of the class answered with the least religious ranking (1), 23.3 percent with the next (2), then 17 percent (3), 9.4 percent (4), and just 3.9 percent with the most religious ranking.
Students were also asked to rate their political identification on a scale from 1 (most liberal) to 5 (most conservative). These results almost paralleled the trend of the religious identification, with an exception: 42.9 percent of respondents identify as moderately liberal (2), and 25.8 percent as very liberal (1). 20.2 percent of respondents identified as moderate, 8.5 percent as moderately conservative, and 2.6 percent as strongly conservative. Just over half, 55.9 percent, of students say they expect to participate in political protests and demonstrations as well. Interestingly, over 85 percent of students who identify as the most liberal and 60 percent of those that identify as moderately liberal expect to participate in protests, while only 13 percent of those moderately conservative and 28.5 percent of those very conservative expect to. It is easy to see that the less moderate students expect to be more active in political demonstrations than their moderate counterparts.
Religious and political identification also appear to be linked. The average political identity for respondents that identify as the least religious (1) is 1.92, or moderately liberal, while the most religious respondents (5) leaned conservative, with an average political identity score of 3.19. Although this trend was not found to be statistically significant, due to the small sample size of the more religious and conservative students, it still offers an insightful glimpse into the political and religious life of the class.
A surprising result arises when comparing the type of home environment and political identity, as connecting city life to be more liberal than that of rural areas is a common political assumption. However, students coming from a rural background identify as more liberal, with an average political score of 1.92, while those from the suburbs and city have scores of 2.16 and 2.29, respectively. However, this could be affected by a self-selecting bias, as students from rural areas that choose to attend university in the city could be different from the population of all rural students, for example.
When asked about politicians, a meager 3.9 percent of students approve of Donald Trump’s handling of the presidency, with 10.2 percent having no opinion, and the other 85.9 percent disapproving. When asked which political candidate from the 2016 election most closely resembled their political views, the plurality of students (41.9 percent) chose Bernie Sanders. Hillary Clinton ranked second (33.9 percent); John Kasich third (9.8 percent); and Gary Johnson fourth (3.2 percent). 2.2 percent of students said they most closely aligned with Trump.
Zero students identifying as strongly liberal approve of Trump’s handling of the presidency, with less than 1 percent of moderately liberal students and 1.8 percent of moderates approving of the same. On the other hand, Trump holds an approval rating of 17.8 percent with moderate conservatives and 64.3 percent with strong conservatives. Even more intriguing, however, is the percentage of each group that responded with no opinion: 0 percent of strong liberals, 2.6 percent of moderate liberals, 25.7 percent of moderates, 40 percent of moderate conservatives, and 21 percent of strong conservatives.
Alcohol and Drugs
The trends for drug consumption follow those of the Class of 2020. 65.7 percent of students have consumed alcohol recreationally, marginally higher than the 61.9 percent of last year, with 66.8 percent planning to consume alcohol during college, a 1.1 percent expected gain in use when in college. However, 31.6 percent of students report having used marijuana recreationally before college, and 27.5 percent of students plan to use marijuana in college, a drop of 4.1 percent. This drop in expected marijuana usage was also detected in last year’s survey.
94.8 percent of the class responded “no” when asked if they have used any other drugs. 94.6 percent, or one fewer person, responded “no” when asked if they plan to use these drugs in college.
Family
As in previous years, most students’ parents are college graduates. Many hold graduate degrees as well, with 64 percent of students’ fathers and 56.2 percent of mothers having completes graduate degrees. More than 90 percent of mothers and fathers have at least a high school education. 80.3 percent of UChicago students do not have a family member that attended UChicago previously, and 9.6 percent, or about half of the remaining 19.7 percent, of students have had at least one parent attend.
Familial education status correlated with students’ political views, specifically the approval rating of Trump: Respondents’ approval of Trump slightly decreased as parental education levels increased. Some high school education for the father and mother led to approval ratings of 7.1 percent and 7.7 percent, respectively, while graduate degrees for the father and mother led to approval ratings of 3.9 percent and 3.2 percent, respectively. Interestingly, however, if the father had an associate degree, the approval rating was 14.3 percent; if the mother had one, the approval rating was 23 percent. These were, by far, the highest ratings among the education groups.
UChicago students also have generally wealthy families, with the biggest bracket, 13.9 percent, of students having a family income of over $500,000 per year. On the other hand, 14.4 percent of eligible respondents reported a family income of less than $60,000. 17.6 percent of respondents were unsure of their family’s income.
All income brackets reported a presidential approval rating less than 8 percent. The two brackets with highest approval were the $30,000–$60,000 and >$500,000 groups, with 7.7 percent and 7.8 percent, respectively. (The small sample sizes of the lower income levels also did not allow for statistical significance.)
On a positive note, UChicago students throughout all income levels are highly optimistic for the future, with a total average of 4.2 from a rating out of 5. Income level did not seem to correlate with students’ political or religious identities.
Education and Test Scores
The majority (55.3 percent) of UChicago students this year comes from public schools, with 40 percent from private (parochial and non-parochial) schools. The remaining percent consisted of students having gone to both public and private schools throughout high school. Students also tended to not have major jobs in high school, as 75.8 percent of students worked 0–5 hours per week in high school, and 89.1 percent of students worked fewer than 10 hours per week. One student reported having a full time job (40+ hours per week).
The average ACT score of students was 33.64, with the 25–75 quartiles being 33–35. We could not report the average GPA of students, as different schools use different weighting systems that skewed the results; nor could we report the SAT score data, as the SAT scores from the new and old tests could not be separated. For the ACT, however, there was a slight correlation between income level and ACT score. Average ACT score at the <$30,000 bracket was 30.7, and scores steadily increased to 33.9 at the >$500,000 bracket. The Class of 2021 took an average of 8.3 AP/IB courses throughout high school.
18.2 percent of respondents reported hiring a private admissions counselor. 5 percent and 8 percent of the $30,000–$60,000 and $60,000–$100,000 groups hired one, while 22 percent and 28 percent of the $300,000–$500,000 and >$500,000 groups used their services. Wealthier respondents were more likely to hire a counselor, with the exception of the $15,000–$30,000 income bracket, in which 18 percent of respondents hired an admissions counselor.
Students were also highly involved in extracurricular activities. Almost three-fourths of students participated in community service. Many students were involved in sports, honor societies, and musical organizations, with 56 percent, 51 percent, and 48 percent, respectively, saying they participated in these activities. Popular clubs of the Class of 2021 include academic bowl, debate, school newspapers, language groups, culture groups, student government, Model U.N., and theater, each with over a fifth of the class involved.
UChicago-Specific
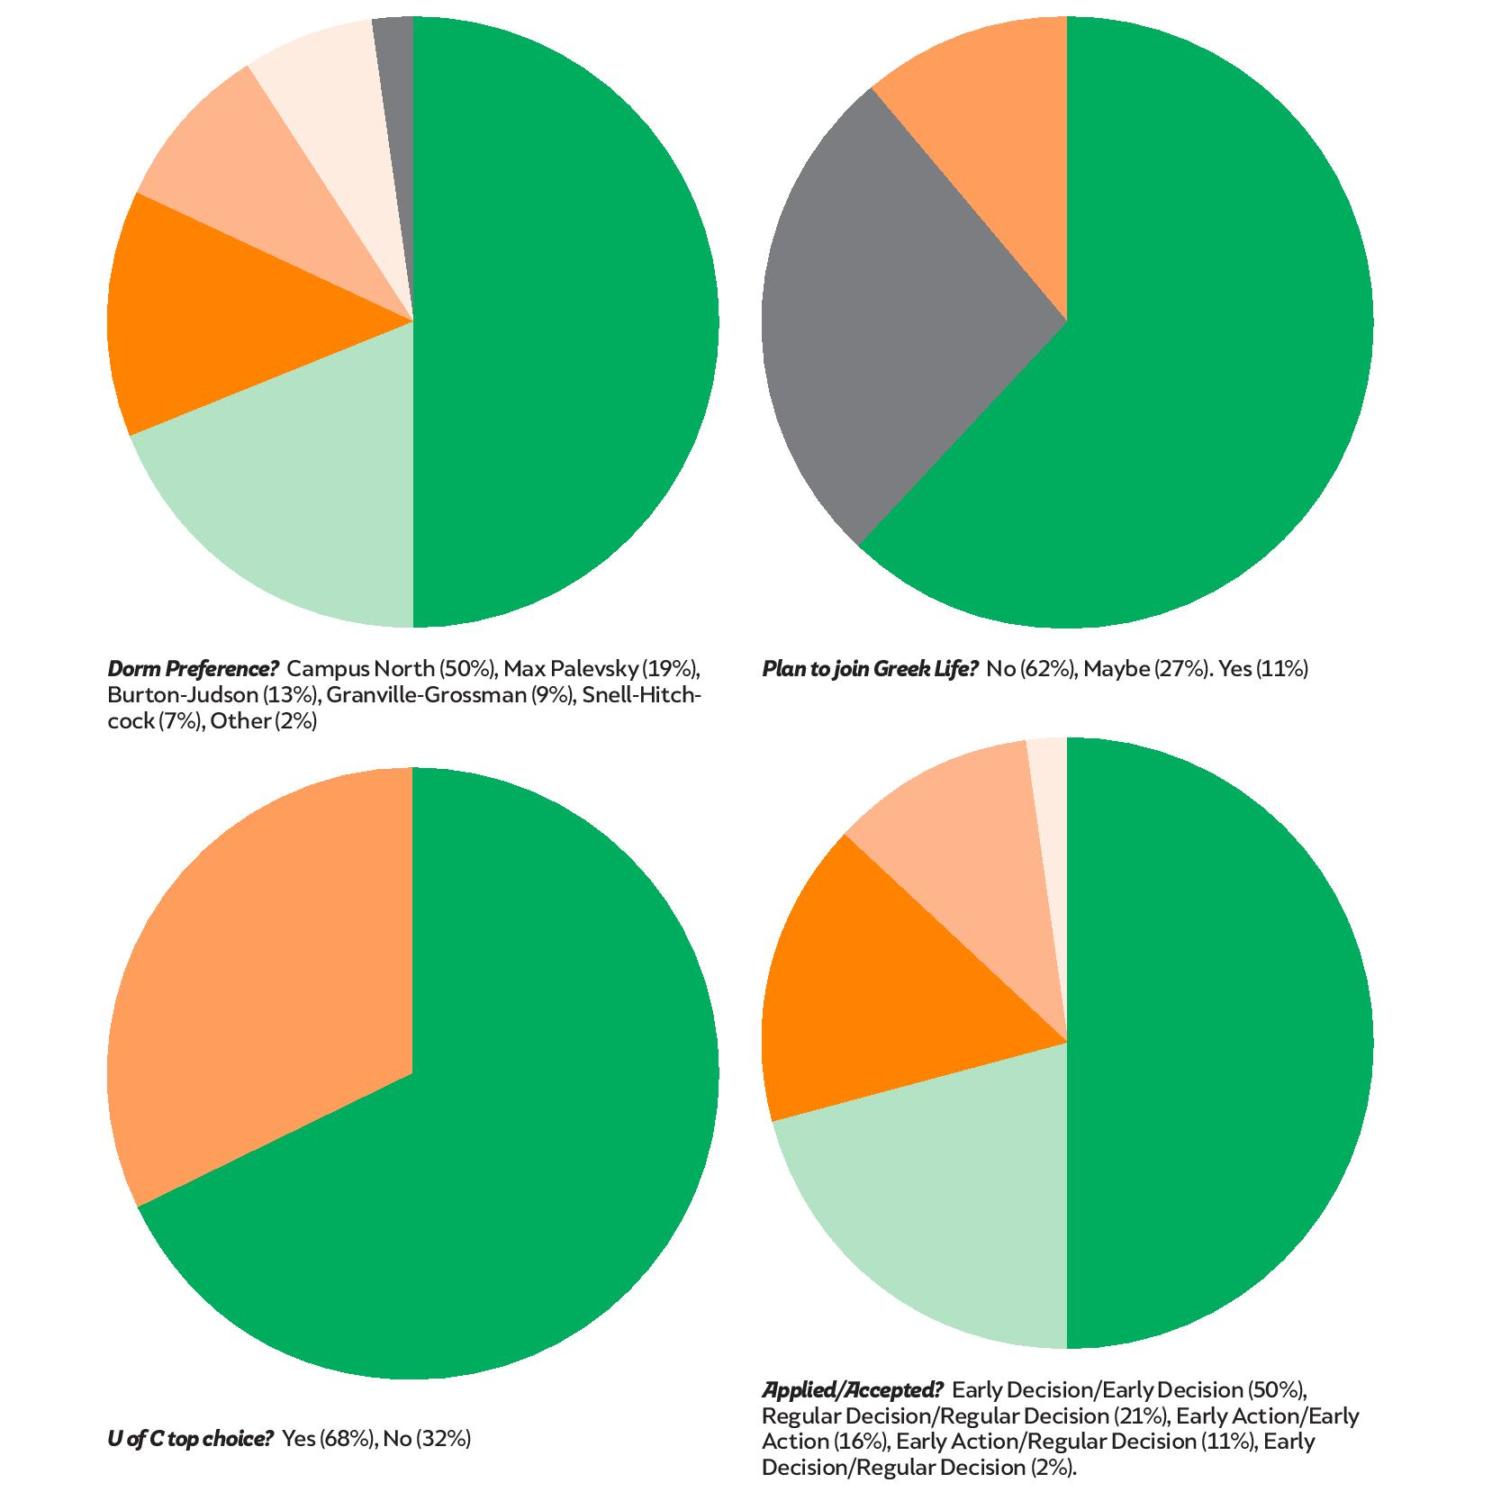
UChicago still remains the top choice school during application for students that currently attend, with 68 percent stating that UChicago was their number one choice. Although this is 1 percent higher than last year’s statistic, this year saw the introduction of the two Early Decision rounds, so it would be expected for the top choice percentage to be somewhat higher. 31.5 percent of regular decision applicants and 59.7 percent of Early Action applicants saw UChicago as their top choice.
Most of the Class of 2021 comes from the early rounds of the application. In the application process, half (50.1 percent) of responding first-years applied Early Decision and were accepted Early Decision. A substantial 79.6 percent of students applied in one of the early rounds, with 16 percent of these students being deferred and accepted in the Regular Decision round. With so many students coming from the newly established Early rounds, it is surprising that the percentage of students that saw UChicago as their first choice hasn’t risen more than just a percent over the past year, as one would assume that more Early Decision and Early Action students would view UChicago as their top choice.
When asked whether it is more important for the University to maintain a positive learning environment by prohibiting certain speech or viewpoints, or to create an open learning environment by exposing students to all types of speech and viewpoints, even those considered offensive and biased, 76.8 percent of students consider the open environment to be more important. Of those who identified as strongly liberal, 58.8 percent found the open environment to be more important, 79.7 percent of moderate liberals, 84.1 percent of moderates, 89.1 percent of moderate conservatives, and 100 percent of strong conservatives.
5.5 percent of students were recruited to play for UChicago in varsity sports, and 14.7 percent plan to walk on to a varsity sport. When asked about plans to play any club sports, UChicago students are rather undecided, with the most popular answer being “maybe,” at 38.1 percent. 68.7 percent, more than two-thirds of students, plan to work part-time while in college as well. Most students did not intend to participate in Greek Life. 62 percent of respondents don’t plan on joining a fraternity or sorority, while 28 percent answered “maybe.” 49.6 percent of students listed Campus North as their top dorm preference, while the least popular dorm was Stony Island, which 0.92 percent, or five students, listed as their top choice.
Not surprisingly, the most popular anticipated major among respondents is economics, with almost a third of students, 32.6 percent, expressing interest in the subject. Other popular majors include biology, political science, math, and computer science, each with around 15 percent interest. The most popular double major interests include economics/political science, economics/math, economics/computer science, and math/computer science. Less than 10 percent of students were undecided. There were 189 unique responses out of 537, suggesting the Class of 2021 expresses a lot of variety in its interests.
The majority of students did not receive need-based financial aid. 43 percent of students reported receiving some need-based financial aid, and 39 percent of students received merit-based aid. Financial aid did decrease as income level increased, as would be expected: at least 81 percent of those from income levels under $100,000 received need-based aid, and all respondents reporting income under $15,000 received aid. The lowest bracket of need-based aid received was the highest $500,000 bracket, where 2.9 percent received need-based aid.
A final interesting correlation lies between admissions status and merit-based financial aid. Those accepted Early Decision and applied Early Action/accepted Regular Decision displayed lower rates of receiving merit aid, with 30 percent and 38 percent respectively. The Early Action/accepted Early Action and Regular Decision groups received merit aid at a higher rate, with 59 percent and 47 percent, respectively. As UChicago would have to incentivize Regular Decision applicants to attend more than those from Early Decision, it makes sense for the Regular Decision merit-based aid to be higher.
Correction: One of our graphs initially stated that 4% of students had no opinion of Trump's presidential performance, and 10% approved. The caption has been corrected to reflect that 4% approve, while 10% are neutral.