Three thousand nine hundred and twelve years. That’s how much time UChicago students have spent on classwork since Autumn 2006.
At the end of every quarter, UChicago gives each student the option to fill out a course evaluation. The Maroon searched through every single evaluation since Autumn 2006 in order to compile some statistics on classes at the University.
In order for a class to be considered, it had to have a minimum of 40 students enrolled beginning in autumn 2006, with an average enrollment of at least five students per class. For comparison, the average class at UChicago has 20.07 students and takes 6 hours, 52 minutes, and 30 seconds of work per week.
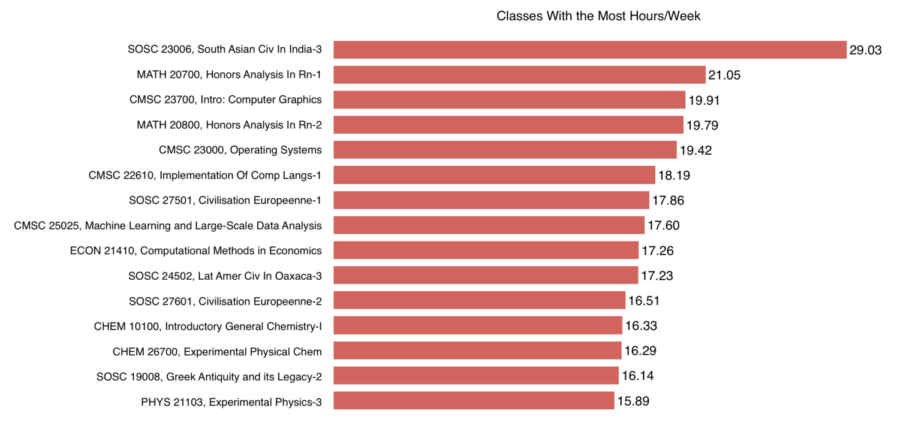
Figure 1 shows which classes take the most hours per week. Third quarter South Asian Civ in India takes the spot as the most time intensive class on campus. At 121 students enrolled over five classes, it’s also not an incredibly small class. It was surprising it won, though, as neither of the first two quarters made the list. It’s also important to note that South Asian Civ in India is a class taken by students who are studying abroad, so students’ schedules are different than if they were on campus.
Honors Analysis also makes a strong showing, with both first and second quarter Honors Analysis making it into the top four most time intensive classes.
Computer science, chemistry, and social sciences take up most of the remaining spots. Computer science has four spots in the top 15, chemistry has two, and social sciences has four. Chem 101 and Sosc 190 are the only 100-level courses on the list. Chem 101 in particular is actually required for many students in the College and is one of the most time intensive classes.
The Sosc classes on this list appear to primarily be Civ classes. Civilisation Européenne comes on the list twice, making one of the toughest sequences in the whole college. It’s again important to note that these classes are taken by students who are studying abroad in France.
Econ only has one class in the top 15, Computational Methods in Economics. It’s also not incredibly popular, with only 55 students enrolled since autumn 2006. We also see one physics class make into this list, the third quarter of Experimental Physics, a sequence infamous for weeding out physics majors.
Before we get looking at the classes, let’s take a minute to marvel at the scale of these numbers. Since 2006, there are specific UChicago classes that have taken decades from their students. The top four most time intensive classes at the University, since autumn 2006, have collectively taken more time than the entire University has been around. We spend a lot of time doing homework.
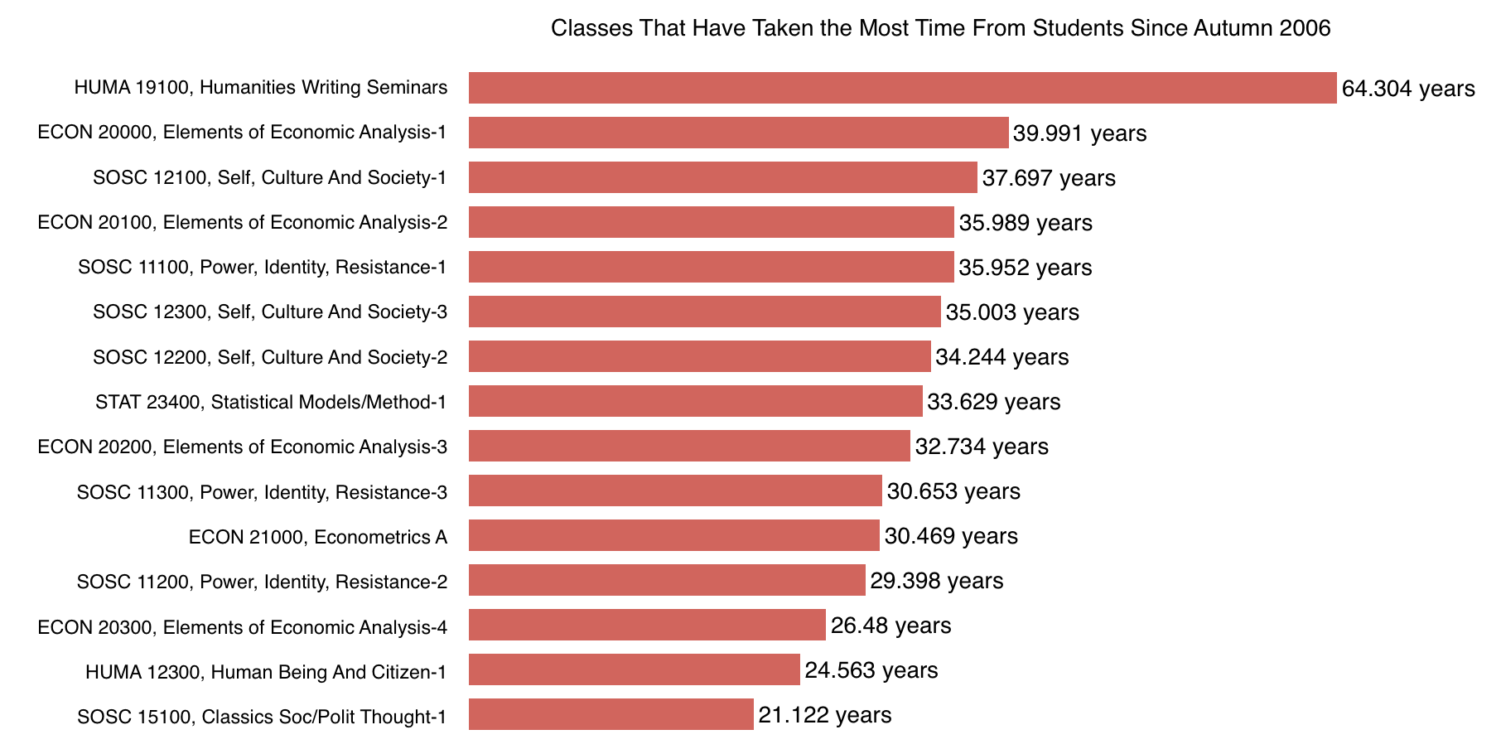
There have been 1525 classes total at the University that meet the minimum size requirements above. So the classes in Figure 2 represent roughly the top 1 percent most time intensive classes.
There are a lot of required classes in the top 15, which is to be expected. Hum Writing Seminars easily clinches the top spot with just over 64 years taken. The way course evaluations are structured, Hum Writing Seminars captures the time required for every Hum class, which every student at the College has to take. However, Human Being and Citizen manages to come in 14th by itself, sucking 24.56 years of time from students.
After Hum, there are a lot of Sosc classes on this list. This is completely to be expected, as there are fewer Sosc classes to sign up for, and each student is required to take three quarters of Sosc. Self is on here for all three quarters, meaning the whole Self sequence has taken over 106 years of time since Autumn 2006.
Stat 234 also comes in eighth. Stat 234 is an advanced introductory statistics class. More importantly, it’s required for the Econ major, which is undoubtedly where most of its hours come from. It’s also one of the more difficult classes Econ majors have to take, as it’s substantially different from the rest of the major. I suspect Econometrics A makes this list for pretty much the same reason.
Finally, all four quarters of the core Econ sequence show up on this list. The sequence has collectively taken just over 135 years of time. About one-fourth of people who have declared a major are Econ majors, which explains this number. What’s more interesting is the attrition that the Econ sequence faces. There were 3,743 students enrolled in Econ 200, 3,168 in Econ 201, 2,867 in Econ 202, and 2,521 in Econ 203. This means that roughly 70 percent of people who take Econ 200 will end up finishing the Econ sequence.
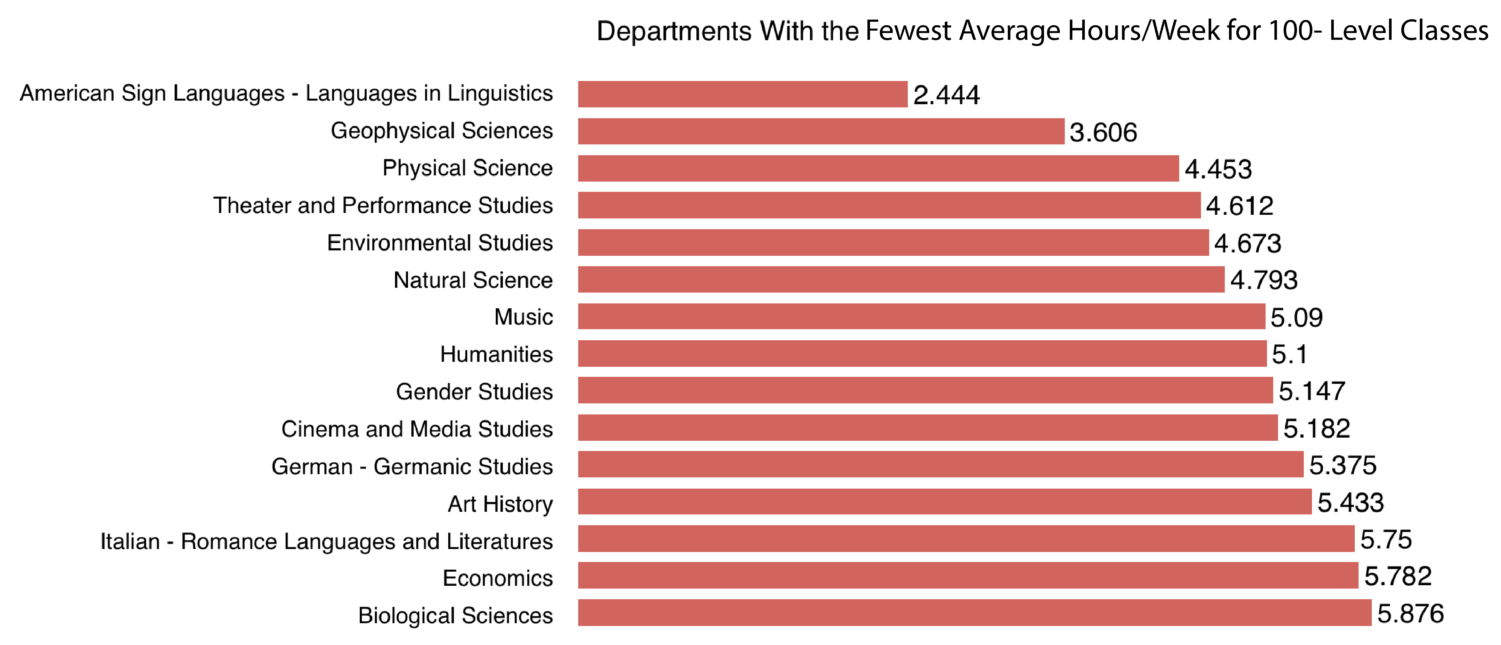
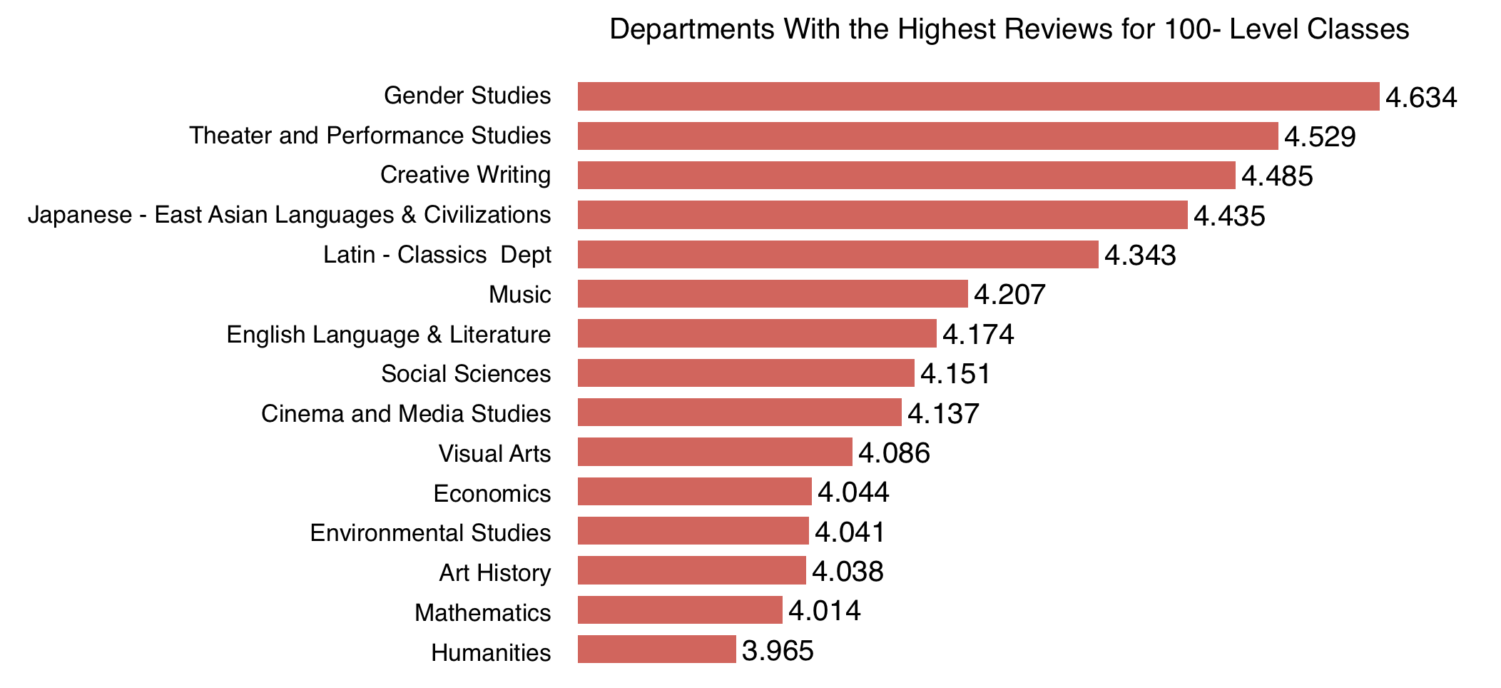
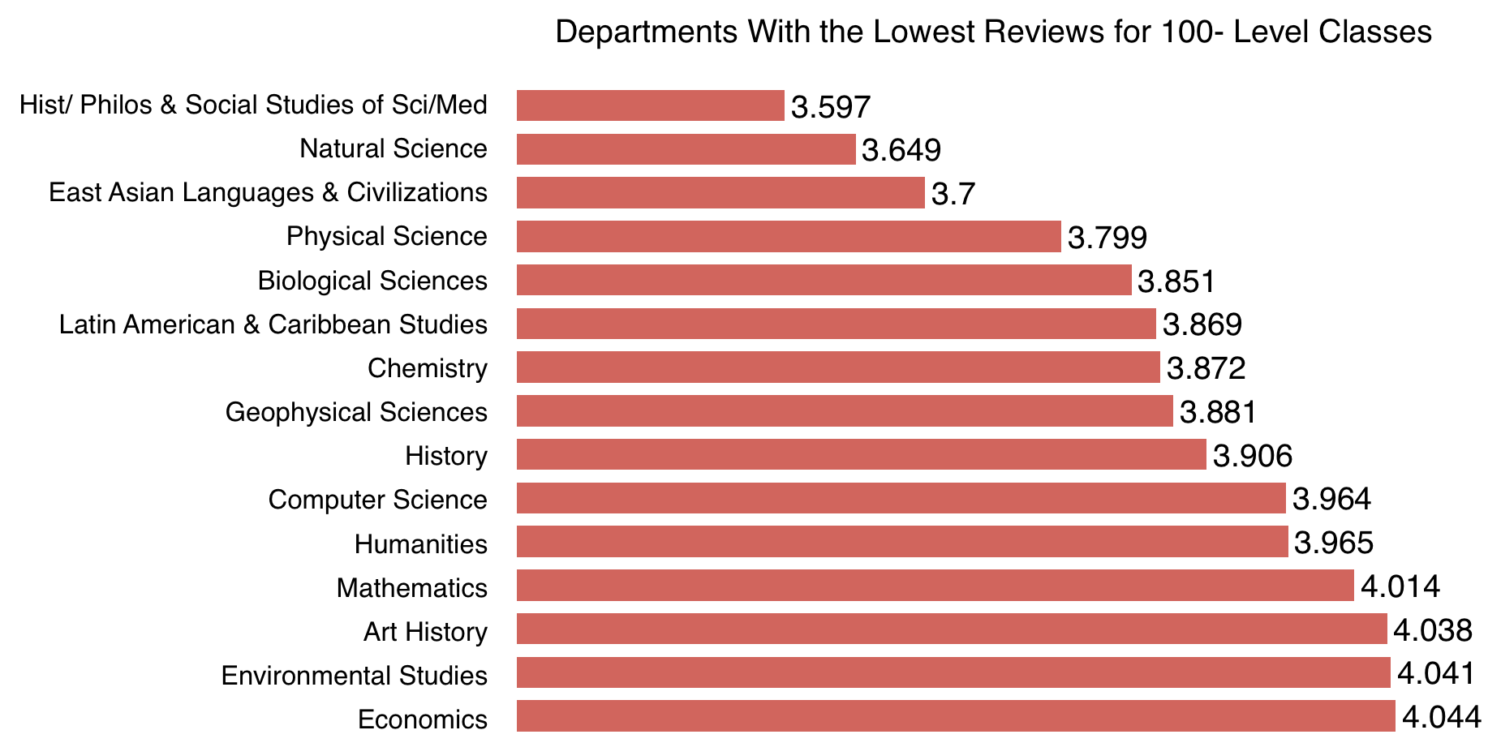
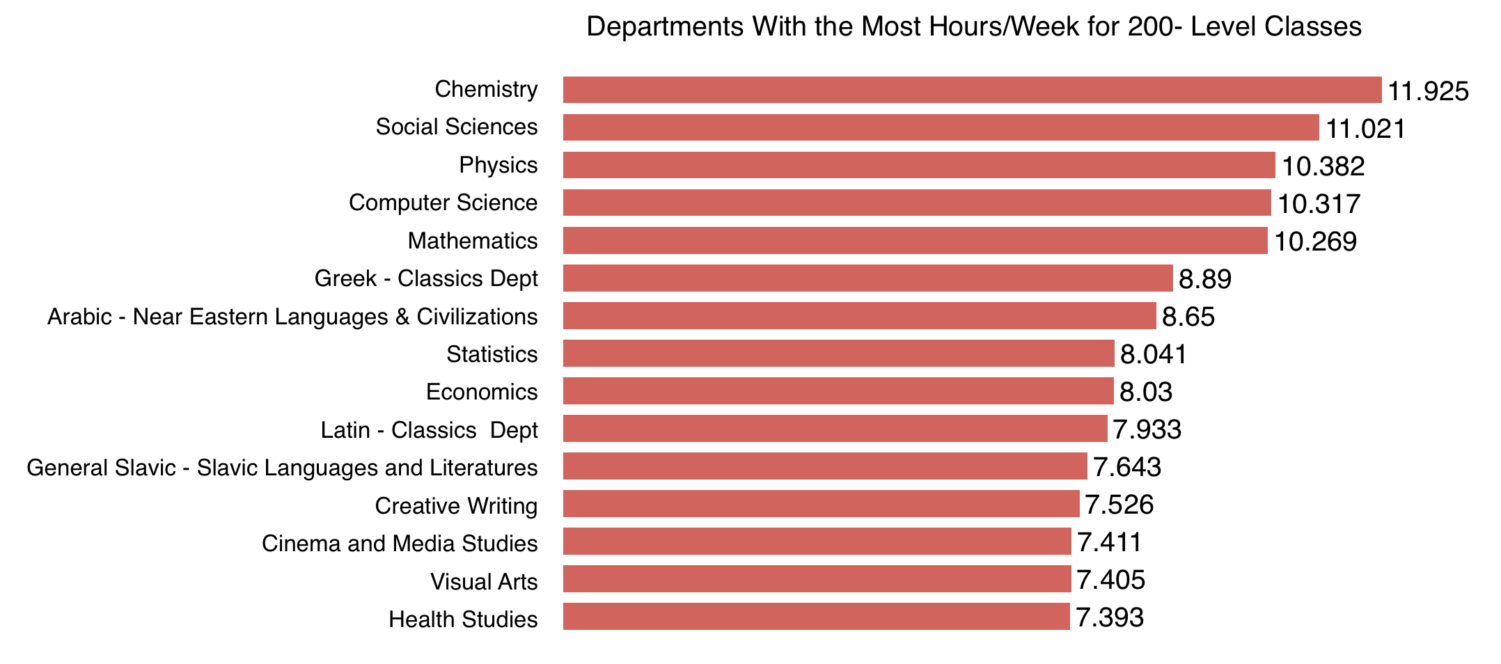
In order for a department to count in these rankings, a department needs to have at least 1,000 non-unique students enrolled since autumn 2006. This means that if I signed up for two French classes, I would count as two different students.
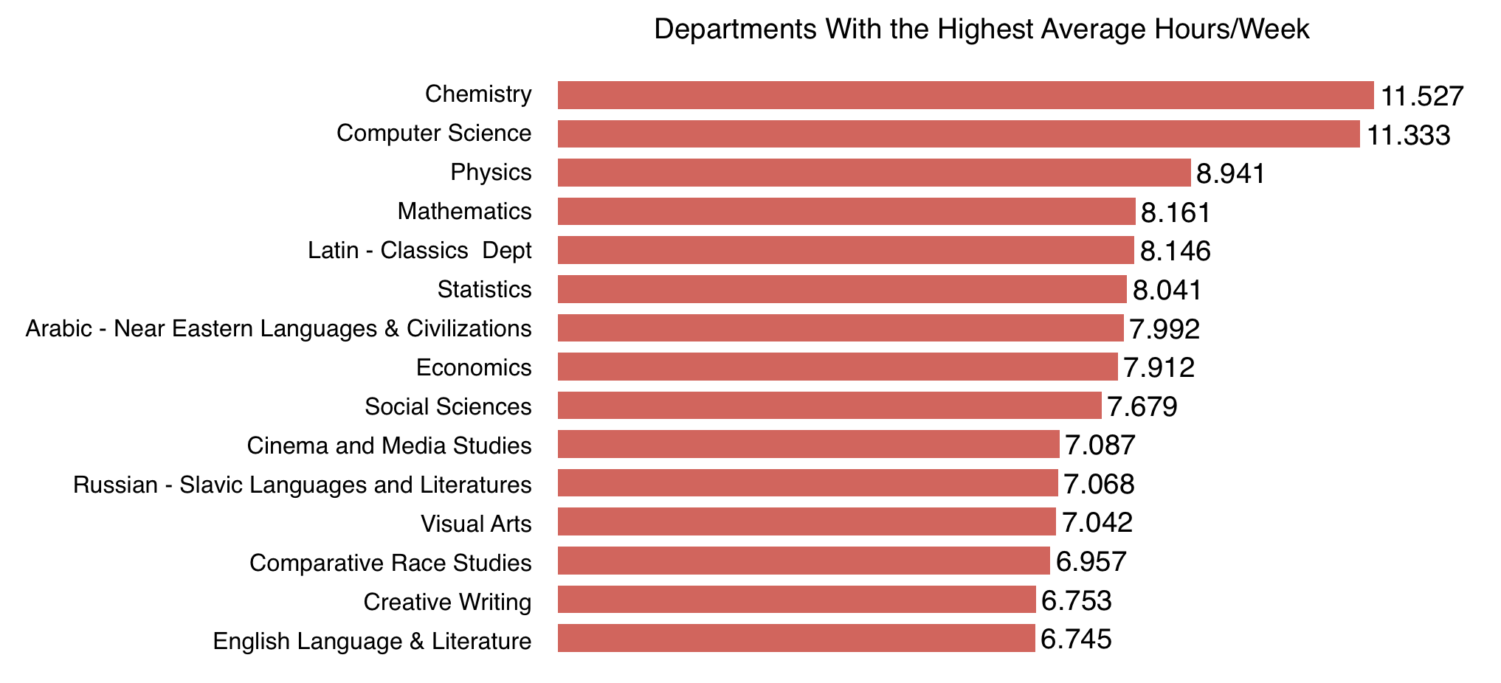
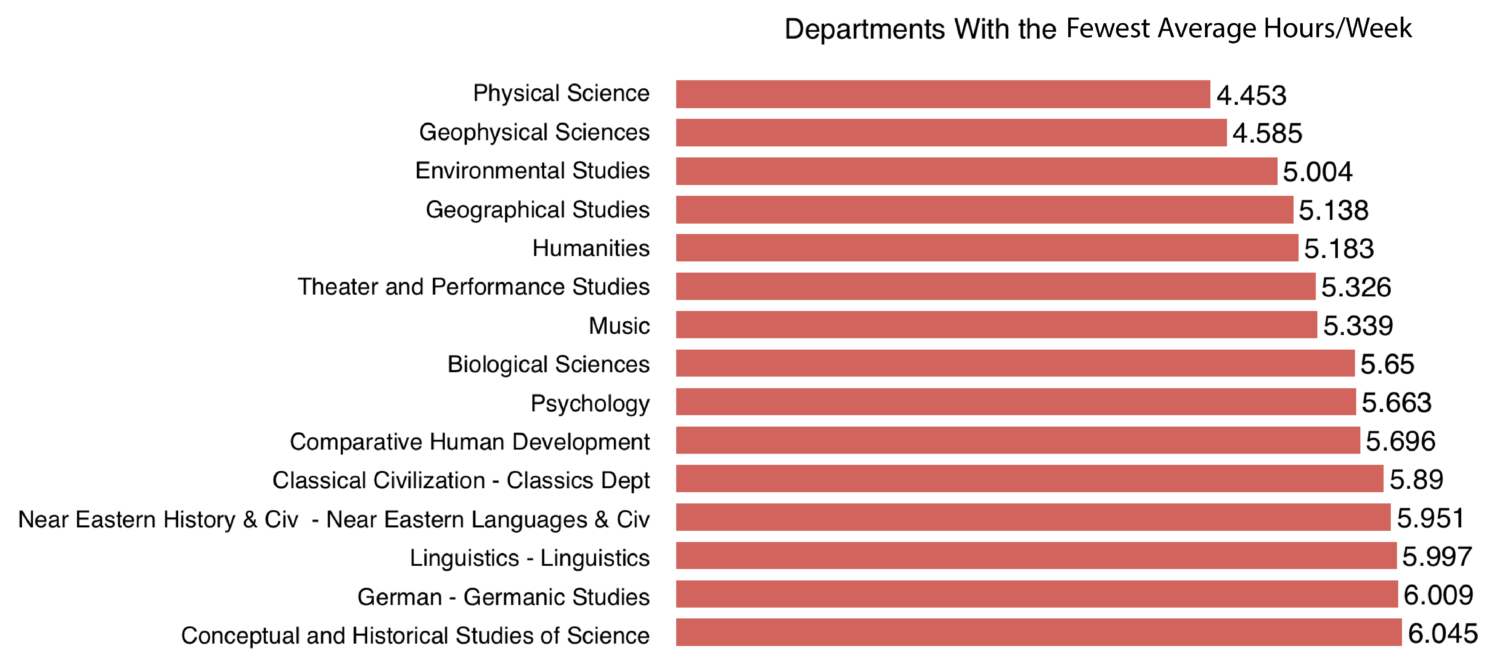
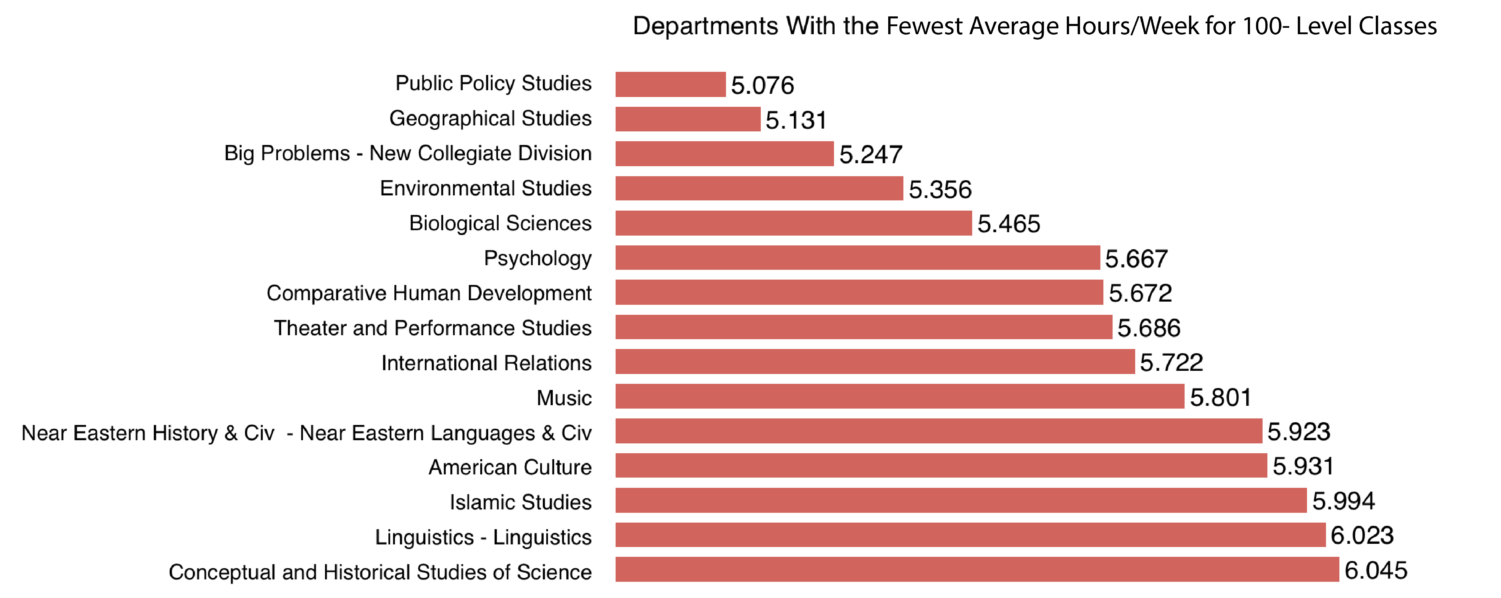
Figure 3 shows the 15 departments in the College with the most reported average hours/week, and Figure 4 shows the 15 departments in the College with the lowest reported average hours/week.
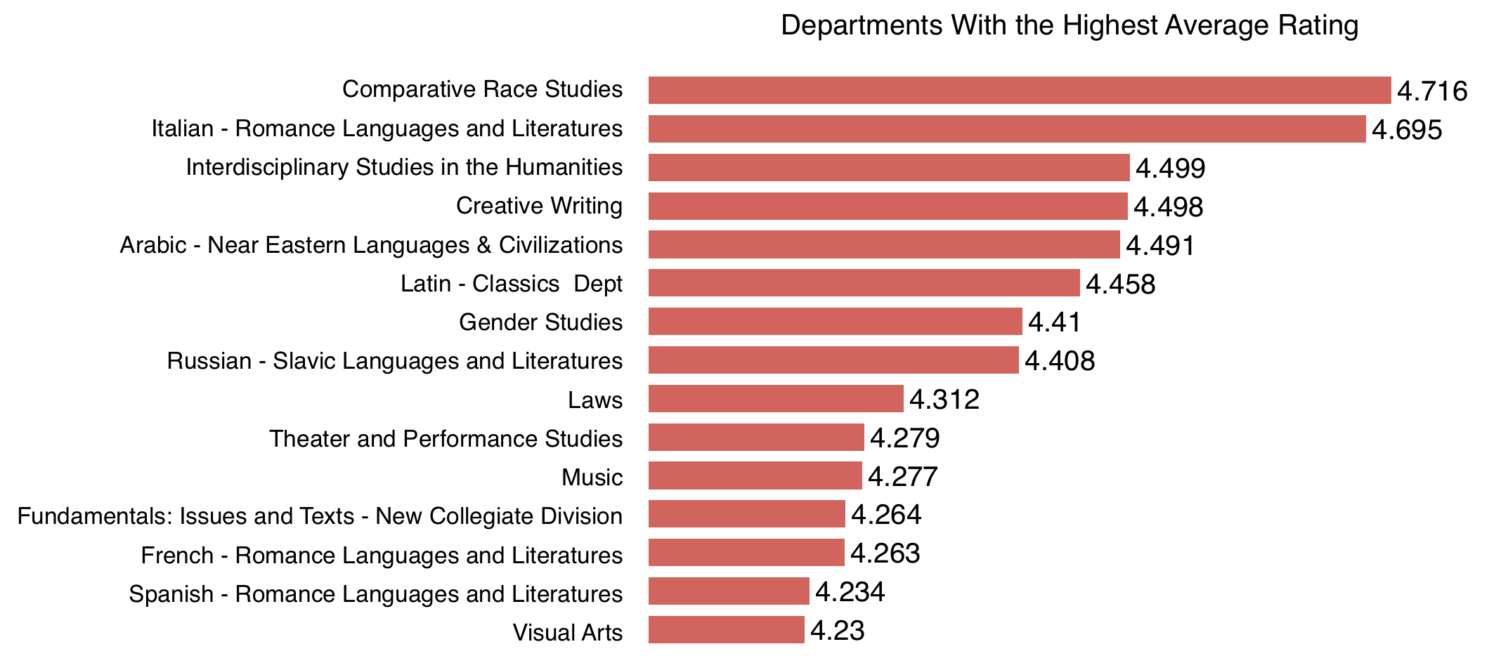
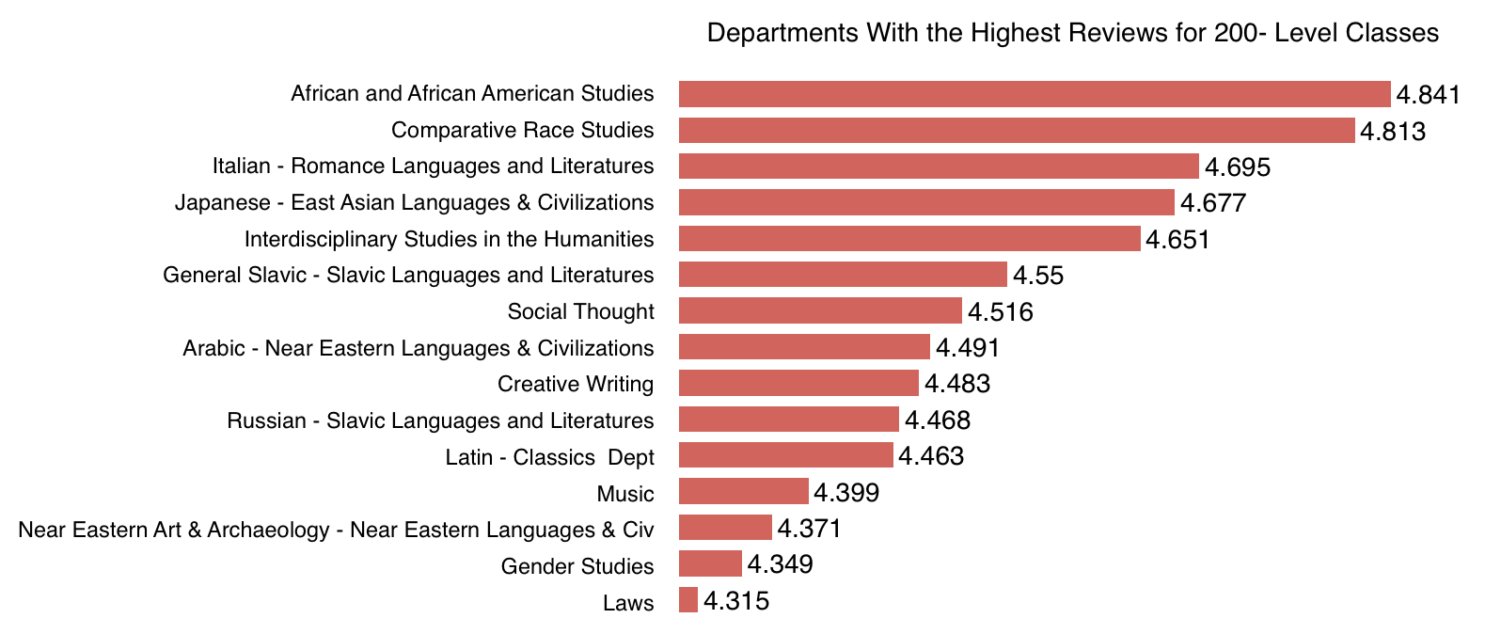
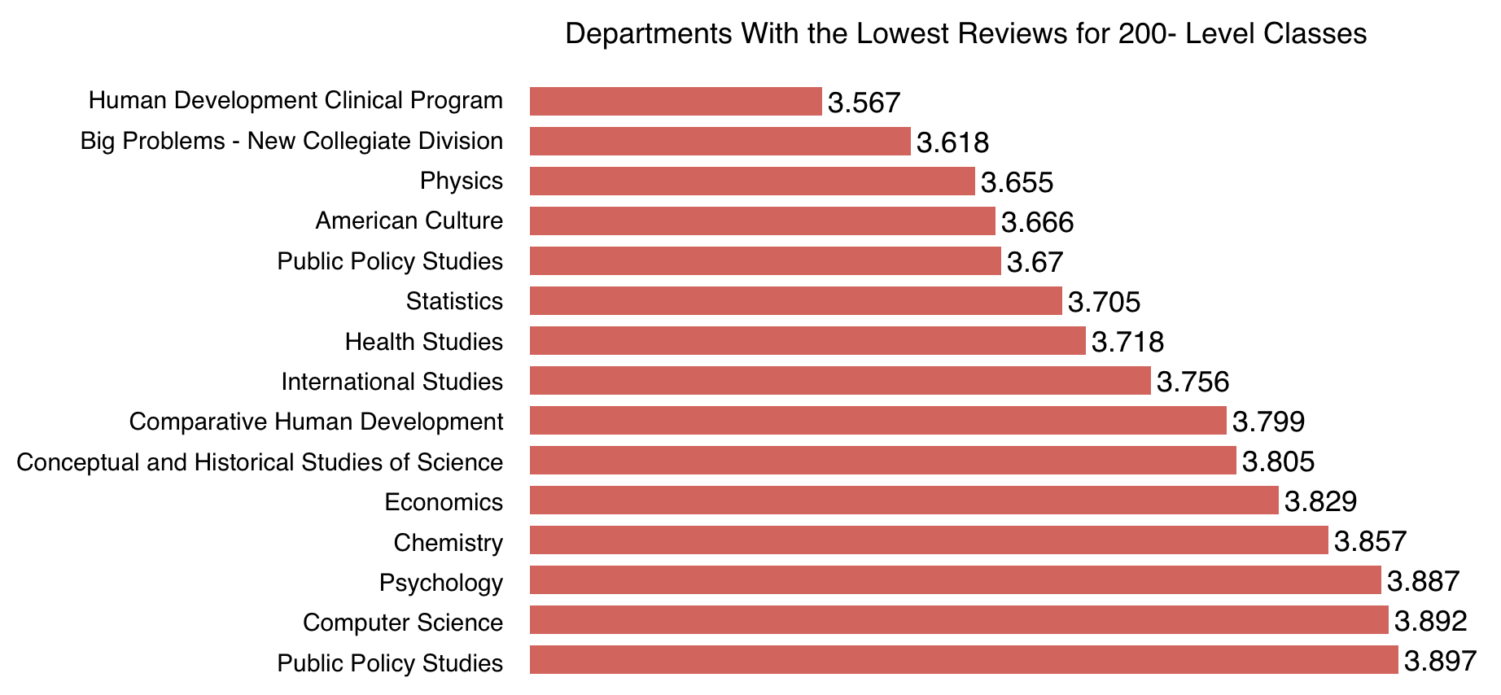
Figure 5 shows the 15 departments in the College with the highest average rating, and Figure 6 shows the 15 departments in the College with the lowest average rating.
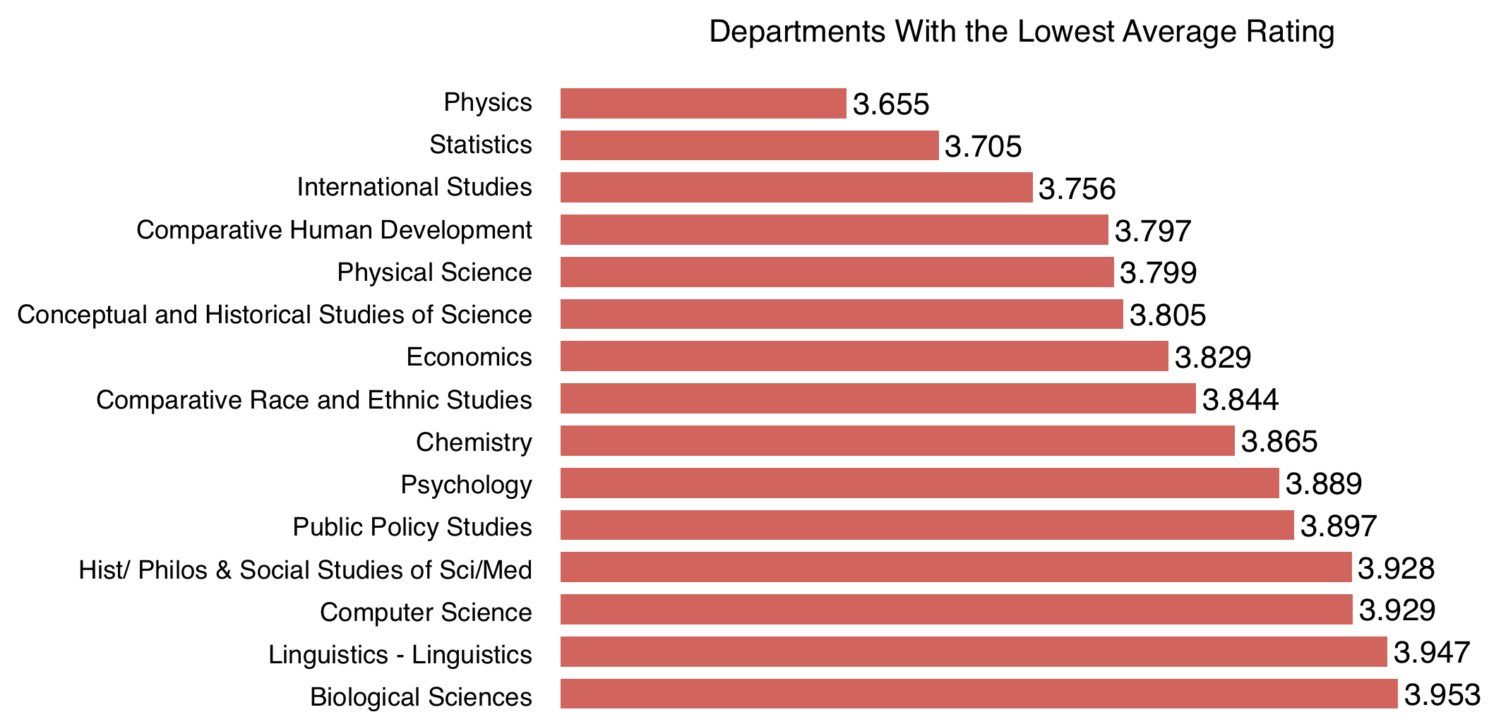
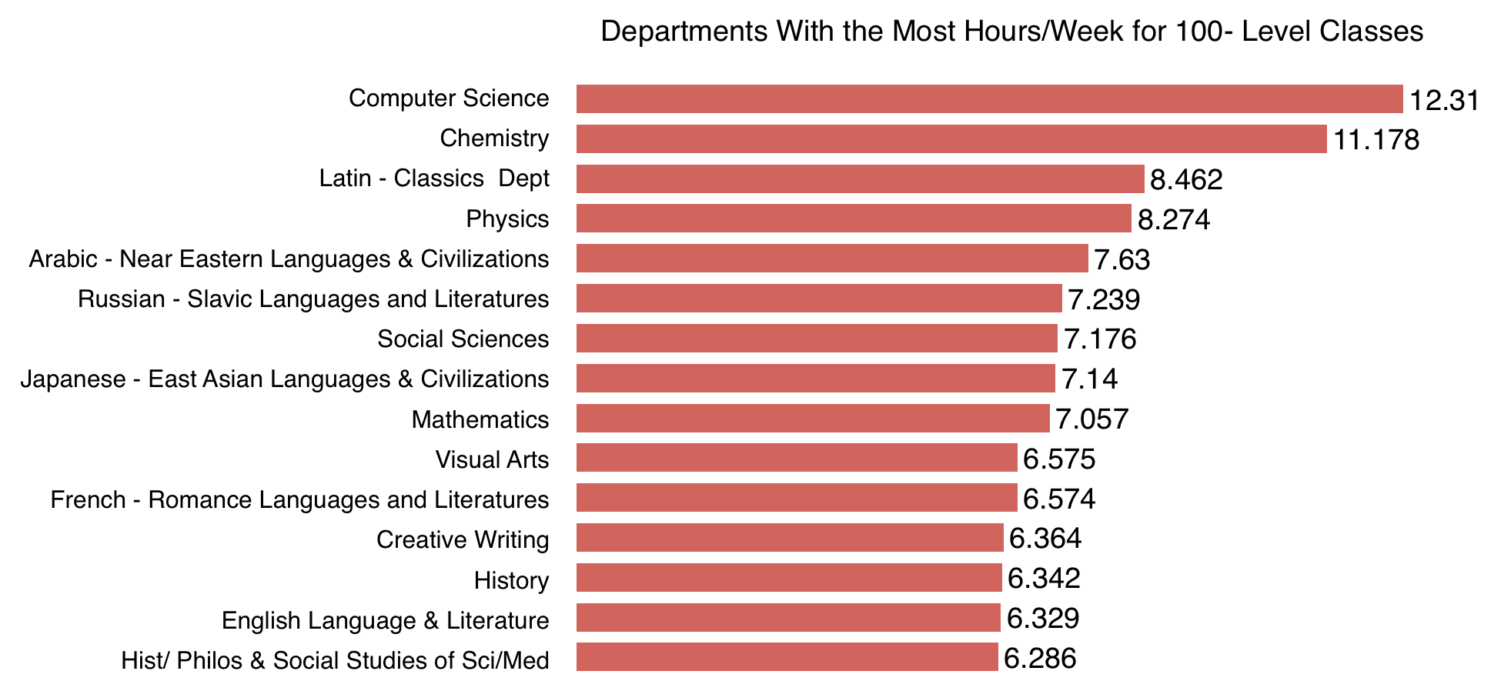
There are several interesting things to recognize, but we’ll just point out a few. First, language classes at the University are highly rated, with six of the top 15 rated departments being language departments. No quantitative departments are in the top 15 highest rated departments though. However, math has the 14th highest rated 100-level classes, and Econ has the 11th highest rated 100-level classes. The rest of the field is dominated by humanities classes.
Physics is rated very low overall. This is part of a larger trend, namely that there are many more quantitative departments that are rated lowly.
Note that some departments had enough classes to be considered in the overall departmental analysis, but not enough 100- or 200- classes to be in those analyses.
A few words on methodology. The course evaluations are completely voluntary, so there’s a significant amount of response bias built into the evaluations. However, we found that 48.51 percent of evaluations are filled out, so the opinions reflect at least roughly half of the campus’s opinion. Evaluations are also skewed towards students perceptions at the end of the quarter, so if a class becomes much harder towards the final, then students might rank it as more difficult. Regarding how the data was collected, we used a Python script to search all of the course evaluations. However, we didn’t want to overload UChicago’s servers, so we put a fairly long delay time in between requests to the server, and we waited until after add/drop to run the script. If anyone else is interested in running analysis on the data, shoot me an email and I’ll send it to you; there’s no reason we need to put unnecessary strain on UChicago’s servers.


